Important features of MS Excel 2016
MS Excel 2016 is more enhanced with its feature. For windows and OS X, MS office 2016 will release tomorrow (22-Sept-2015). You can easily download its preview from the official site and they are also providing the product key for office 2016 preview. This preview will be available on your system until you uninstall office 2016 preview or office 2016 is released. So get ready to know about few of them like Power-Query and Business Analytics. Read this post to know about them.


Power Query
Power query is not a new feature for Excel users but this time it is more integrated and available as an inbuilt feature of MS Excel 2016. This feature is available in Excel 2010 and 2013 as Add-in. In MS Excel 2016, this feature is available in Get & Transform section which provides fast, easy data gathering and shaping capabilities.
Image courtesy: Microsoft
I will discuss some important feature that you can achieve with power query in Excel 2016:
Data Connectivity: This feature is more updated in Excel 2016. It also helps to combine and filter the data. Now you can easily connect with the new data sources like Facebook and Salesforce to import the data. This is the new change in MS office 2016. As previous versions it also imports data from Files, Database, and Azure etc as shown in the figure:

Data Shaping: Query editor is the most significant feature of this new release. You can easily see the preview of your data and perform modification such as remove, pivot and unpivot columns with the help of query editor.
Data catalog: You can use this option to find the data according to your requirement. This is possible by the power BI enterprise catalog. To use this, you should have the power BI license.
Business Analytics
Any result is based on the analysis factor and it should be clear from the beginning of the project. Take a look on the following process:

Let’s discuss some features of business analytics of MS Excel 2016.
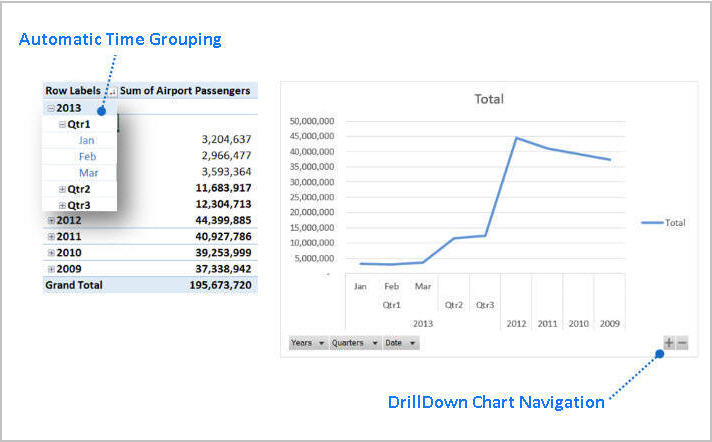
Modernized Data Analysis: Data analysis always plays an important role for every project growth. This feature is wonderfully enhanced in Excel 2016.Now you can be more focused on uncovering the insights rather than managing your data. I read about automatic time grouping and drill-down chart navigation feature to improve the usability. You can see them on below image:
New and Improved Charts: With this option, Excel 2016 has fined the new idea to expand the visualization of data by improvement in charts. It has the new set of modern charts with a consistent look and feel. With this option, you can easily understand the percentages of data. See the most useful charts, waterfall and sunburst in the image below:

Excel Forecasting Function: You can feel the best experience of forecasting by FORECAST.ETS() function. You can see some reasonable results on the image below:

Sum Up: Power Query and Business Analytics are very interesting features in MS Excel 2016. Efficient data connectivity will make data importing more easy and by the use of query editor, user can shape the own data according to need. Similarly, Business Analytics feature will make your work easy in a graphical manner.

Comments
Post a Comment